Hello Friends welcome back,
In our last posts, we deep dived into Measures of Centrality and learned about facts on Mean, Median & Mode. I strongly recommend to go through this post before continuing this article.


By now we know that for Quantitative Data (i.e. Numerical Data) we have below 3 summaries.
- Measures of Centrality –> Mean, Median & Mode
- Percentiles –> Quartiles, Quintiles, Deciles
- Measures of Spread –> Range, IQR, Variance & Standard Deviations
Continuing our previous post on Measures of Centrality, we will extend those basics of Statistics with deep diving into Measures of Spread. Lets start our first objective in understanding Spread is “Percentiles”.
Table of Contents
What is Percentiles?
Suppose you score 45 out of 100 on a test, how would you rate your performance ? Good or Bad ?
- Is it bad ? (because you scored less than 50%).
- But, what if the questions are really hard ? And not many in the test score more than 50 ?
Reframing the above question, suppose you scored 45 out of 100 on a test. Out of 100 students, only 2 scored greater than 45. How do you rate your performance ?
- Does it look good ?
“You can proudly say that you lie in the top 98 percentile of your class (the score of 98% of students was less than or equal to your score)”
So, the p percentile of a sample is a value such that p percentage of the values in the data are less than or equal to this value. Example: Let us consider below data set which has 25 data points which are sorted in ascending as below.
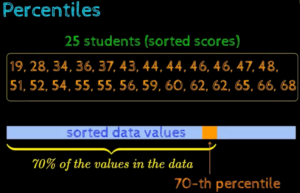
Understanding percentiles
From above picture, we can understand that we need to filter 70th percentile, we are looking that value in the data such that 70% of values in the data is less than that. Now, how do you compute this value ?
Procedure to Compute Percentile:
- Sort the data
- Compute the location of p-th percentile using formula: Lp = p/100(n+1) where n -> total no of data points we have.
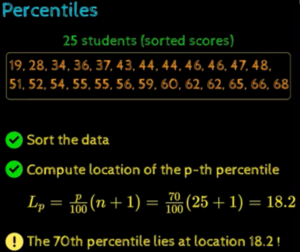
compute location of pth percentile
For our 25 data points, we need 70th percentile value. Substituting in our formula, our location is at 18.2. This sounds peculiar !! Do we have any such position as 18.2 ? Intuitively the location 18.2 lies between position 18 & position 19, but closer to 18 than 19. The difference between the value located at position 18 & 19 is 3 and we need .2% of this, hence we can compute the value as 56 + 0.2 * (59 – 56) = 56.6. Refer below image.
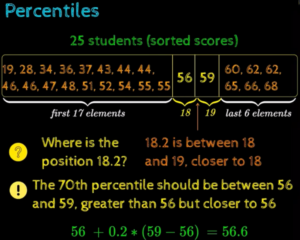
Computing percentile value
Summarizing, if the position obtained using formula: Lp = p/100(n+1) is fraction, then compute Yp = Xip + Fp * (Xip+1 – Xip).
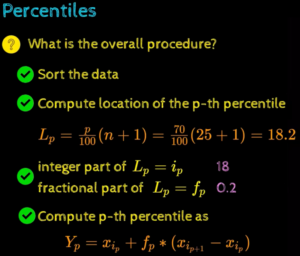
Percentile complete formula summary
Frequently Used Percentile
What are some frequently used Percentiles? We might have heard like Quartiles, Quintiles, Deciles…. Let’s understand these terms clearly with our previous example data set that has 25 data points in sorted.
Quartiles
Quartiles divide the data into 4 equal parts where p takes 25th percentile / 50th percentile / 75th percentile. We call these equally divided parts as Q1, Q2, Q3 & Q4.
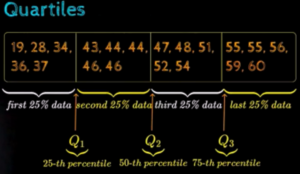
Understanding Quartile
Note: Median is same as Q2. By definition Median is 50% of data points are less than that value & Q2 also refers the same.
Remember from our previous article on Centrality, we know the formula for Median: Xn+1 / 2 if n is odd or (Xn/2 + Xn+1/2) / 2 is n is even. Strange that now we have 2 formula to compute the Median i.e. either by 50th Percentile formula or Median formula. Are they same & yield same value as output? Refer below image for proof, that both the formula’s converge and are same as other.
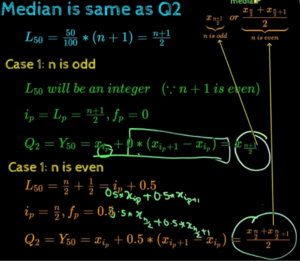
Median vs Quartile2
Quintiles
Quintiles divide the data into 5 equal parts where p takes 20th percentile / 40th percentile / 60th percentile / 80th percentile. We call these equally divided parts as Q1, Q2, Q3 , Q4 & Q5. Refer below image for details.
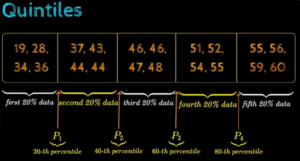
Understanding Quintiles
Deciles
Deciles divide the data into 10 equal parts where p takes 10th percentile / 20th percentile / 30th percentile / 40th percentile / 50th percentile / 60th percentile / 70th percentile / 80th percentile / 90th percentile. We call these equally divided parts as Q1, Q2, Q3 , Q4 , Q5, Q6, Q7, Q8, Q9 & Q10. Refer below image for details.
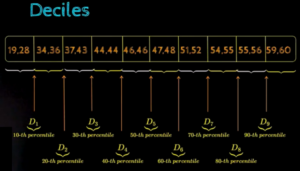
Understanding Deciles
Compute the Percentile Rank of a value in Data
Let’s take our dataset of 25 data points. Now, a student has obtained 44 marks. How will you rate his performance compared with other students ? Or We are interested in knowing the percentile rank of the student who scored 44.
What is Percentile Rank?
The Percentile Rank of a value is the percentage of data values that are less than or equal to it.
Understanding percentile rank
How to compute Percentile Rank?
- Sort the Data
- Then apply the formula: PRs = (Cs + 0.5*fs) / n * 100 where PRs –> Percentile Rank of Score s, Cs –> No of Value less than s, fs –> No of value equal t0 s.
Percentile rank example
For our dataset Cs is 6 i.e. total 6 values less than 44 & fs is 2 since 2 values of 44 found in the data. Substituting in our formula, it turns out that PRs is 28 i.e. 28% of values in the data are less than value or equal to 44. Now we can assume that person who score 44 performed bad only 28% of students less than him/her and 72% of students scored greater than him/her.
Effects of Transformations on Percentile
From our previous articles, we learned transformation includes Shifting or Scaling or combining both. So if we shift & scare our original data, the location of percentile value we are interested wont change, only the percentile value gets scaled. Refer below image for proof.
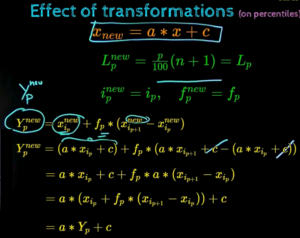
Percentile transformation
Summary
I hope now you have a clear understanding on Percentiles , which are part of measuring spreads in our data. Lets quickly summarize our learings
- Percentile is, in sorted data, p% of the values in the data is less than the pth percentile
- To compute percentiles, we need to find its location using Lp formula, if the location turns out to be fraction, then use Yp formula
- Frequency used percentiles are Quantiles, Quintiles, Deciles
- Computed finding percentile rank of the value
- Affects of transformation on percentiles.
Do share your feedback on this article for suggestions and improvements. I owe this article to Prof. Mithesh Khapra’s excellent course on Introduction to Data Science at padhai.ai website.


In our next article, we will look into Measures of Spread – Variance and Standard Deviations. Do check out our previous articles on
Normal Distributions – https://ainxt.co.in/fun-with-functions-to-understand-normal-distribution/
Confidence Intervals – https://ainxt.co.in/how-confident-are-you-with-confident-intervals/


[…] Measures of Spreads – Percentiles – Facts and Insights […]
[…] Lets sum up the learning we had so far. It is necessary that one must strong enough in Linear Algebra, Probability, Statistics & Calculus to understand the mathematics inside learning algorithms. […]