
Hello Friends welcome back,
Any one who desires to become Data Scientists or get into role of Analytics, cant skip Statistics. Stats play a big role to understand the complex block of Analytics.


The Basic building block of Statistics are – Measures of Centrality and Spread !!
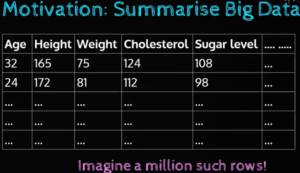
Why do we need Measure of Centrality & Spread ? –> Imagine in real world, we have millions of data arranges in Rows and Columns. Very hard to get the sense of data by having physical look. Hence
- We can drawing plots can be an good Visual Summary
- In some situations, we want even more succinct summary that given a idea how the data look alike !
Now, these summaries are called as Statistics(Estimator of Population). For Quantitative Data (i.e. Numerical Data) we have
- Measures of Centrality –> Mean, Median & Mode
- Percentiles –> Quartiles, Quintiles, Deciles
- Measures of Spread –> Range, IQR, Variance & Standard Deviations
Table of Contents
Measure of Centrality
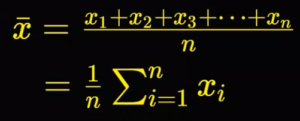
Mean: Simply the average of data points i.e. Sum of collection of Numbers / Count of Numbers in Collection
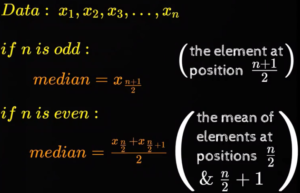
Median: Is the value which appears at the center of the data when data is sorted. We have 2 cases when no of data points is odd/even, depending on which the median will differ and is given as below.
Mode: Defined as most frequently occurring value in the dataset.
Characteristics of Measures of Centrality
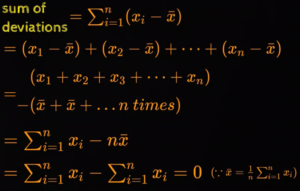
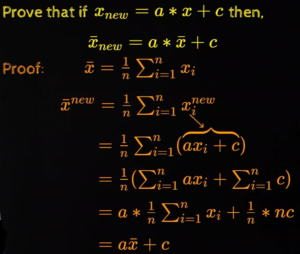
Mean is known as “Centre of Gravity of Dataset”. The deviation of a point from the mean is defined as the difference between this point and the mean.
Note: “The Sum of the deviations of all points from the mean is 0”. Refer below screenshot for proof!!
Sensitivity of the Measures of Centrality to Outliers
Outliers are any point which is far away from the other values in the data.
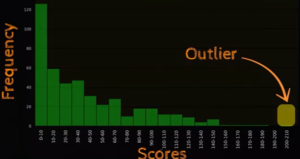
Hey, means are very sensitive to Outliers. But median & mode are not so sensitive. Therefore to account for the sensitivity to outliers it is advised to compute the “Trimmed Mean”. Trimmed mean is computed by dropping K extreme elements from either side before calculating mean. Example, refer below screenshot.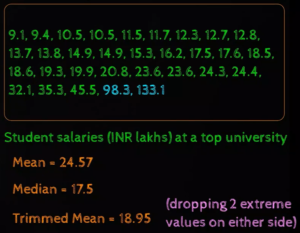
Points to Remember:
- Perfectly symmetric distribution – It is observed that Mean=Median=Mode.
- Left skewed distribution – Mean < Median < Mode
- Right skewed distribution – Mean > Median > Mode
Effects of Transformation on the Measures of Centrality
- Scaling: Multiply/Divide each value in the dataset with constant value i.e. Xnew = a*X
- Shifting: Add/Subtract each value in the dataset with constant value i.e. Xnew = a+X
- Scaling and Shifting: Combination of both i.e. Xnew = a*X + b
When transformations applied to mean, the new mean also gets shifted or scaled accordingly.
However, transformations doesn’t have impact on median. Similarly scaled value of the mode will be the new mode.
Summary:
- Mean is sensitive to outliers but median is not
- Mean is the center of gravity of the data
- Effect of Skewness/Transformations: Mean varies accordingly, however Median & Mode has less or no effect
You can also learn about Sampling and Confidence Interval from our earlier blog posts.
Some of the Books to refer more on this topic,


[…] of Spreads – Percentiles – Facts and Insights !! Previous Measures of Spreads – Percentiles – Facts and Insights […]
[…] Measures of Centrality: Mean, Median & Mode […]
[…] we released series of articles related to Statistics and Probability that helps you to refresh the basics to get into stronger mathematical foundations when learning […]
[…] https://ainxt.co.in/measures-of-centrality-facts-and-insights/ […]