Hello Friends,
Welcome to our one more article on Measures of Centrality. In our previous 2 articles we have discussed about
These 2 articles are building blocks for this article. Recommend to go through these articles, to grasp the best out from this post. By this time, we know “Measures of Centrality” quickly helps to summarize our huge data. We understood the importance of understanding Mean, Median, Mode & Percentiles of given data before making any inference. Measures of Centrality don’t tell us anything about the Spread and Variability in the data. Now, we are moving into one more important measures that we need a thorough and clear understanding – Variance and Standard Deviations.


Table of Contents
Range
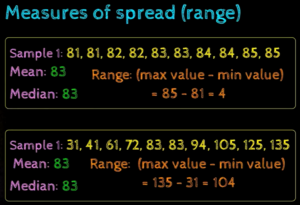
Simplest measure of Spread – Range of Data. This tells the difference between maximum element in the data and minimum element in the data. Range helps to compare the variability/spread between 2 datasets.
Understanding Range
From above image, we have 2 samples given. For the 1st sample the difference between max and min value in the data is 4, however for 2nd sample, the difference is 104. Hence, it is clearly understood the 2nd sample has huge spread in the data points.
Note: Just like mean, the range is very sensitive to outlier. Just if we have one data point which is far away from rest of the data points, the range gets impacted.
Inter-Quartile Range (IQR)
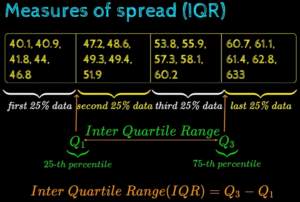
It is the difference between 75th percentile (Q3) of the data and 25th percentile (Q1) of the data. Remember, in our last article, we have gone through the methods to calculate how to compile percentile. Formula: IQR = Q3 – Q1
Understanding InterQuartile Range
Note: IQR is not sensitive to Outliers. IQR will not drastically change, if we drop outliers in the data.
Lets analyze the given data set to find IQR. First need to compute 75th percentile value & 25th percentile value using our percentile formula and the calculate the difference. It turns out that for the data set give IQR is 13.4. Refer below image for details.
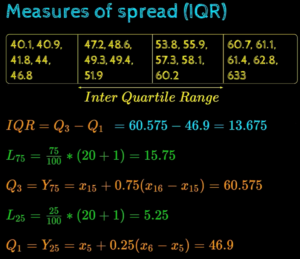
Calculating IQR
Measure of Spread – Variance & Standard Deviation
Finally, we reached our favorite point of this article – the Variance and Standard Deviation. The Question to be raised to understand Variance is “How different are the values in the data from the typical value (mean) in the data“. Possible solution for the question we have asked is “Compute the sum or average deviation of all the points from the mean“, but the problem for this solution is we already know that sum of deviation from the mean is “0”.
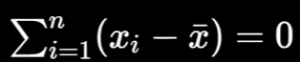
Mean summation
Therefore sum of deviations does not tell us anything about the spread of the data. This is because mean is our center point and deviations of the data points on left side of the mean will cancel out with the deviations of the data points from left side.

variance difference
So what we can do to avoid this balance out nature of data from mean ? Now we have 2 solutions to avoid this cancel effect.
- Method1: Use absolute values
- Method2: Use Square of the values. Called as Variance formula. This is our preferred solution.
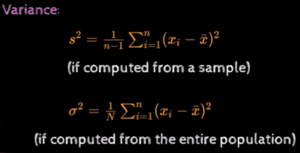
Variance formula
Note: Refer our article on understand more about Sample & Population – https://ainxt.co.in/statistics-and-sampling-distribution-through-python/
If we closed observe the formula for Variance, we have squared the difference of value from the mean. Due to this, variance is not measures in the same unit as the data. Example: If the original unit of data is Km, then the unit of variance is Km^2. Hence we have other measure of spread – known as Standard Deviation, which is simply the square root of Variance. Now standard deviation is measured in the same unit as the data.
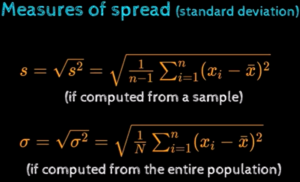
Standard Deviation formula
Why do we Square the Deviations ?
Reason1: The square function has better properties than the absolute function. The square function is smooth function and hence differentiable everywhere. But absolute function is not differentiable at 0. Why do we care about differentiability ? In may ML applications, we need functions which are differentiable.
Reason2: The square magnifies the contribution of outliers.
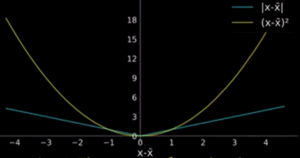
absolute vs square
Variance – sometimes we can refer as Measure of Consistency. Example: The primary objective of manufacturing industries is to ensure that there is little variance in their products.
Effect of Transformations on Measure of Spread
We now know Scaling & Shifting are transformations we can apply on our dataset. We have gone through detailed discussion about this in our Measures of Centrality article. In measure of centrality – Mean, Median & Mode, we noticed both scaling & shifting happens. However in Measures of Spread, there is no effect for transformations as it gets cancelled out and only scaling has effect.
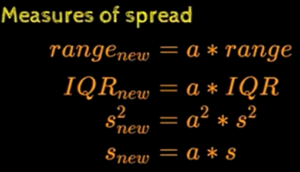
Transformations on variance
How to use Mean & Variance to Standardize Data
Suppose we have a data set and we are interested in knowing how many Standard Deviations away from the mean to the data point value X. Idea here is instead of expressing the distance between data point & mean in absolute values, we are expressing them in units of Standard Deviation. If Xbar is the mean and s is the standard deviation, then the point which is one standard deviation away from the mean is One Standard Deviations.
Formula: Xi = Xbar + Zi * s where Zi = (Xi – Xbar) / s
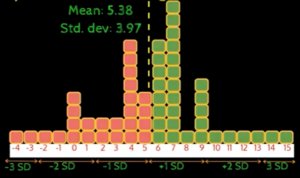
Standardizing data
Note: Mean = 0 and Standard Deviation = 1 for Standardized Data.
Zi is called as Z-Score and tells us the number of Standard Deviations that the point is away from mean. Standardizing the data is very importance when we apply any machine learning algorithms in the data points. Having non-linear data will cause our Machine Learning models to be biased with those variables that have higher data range.


Summary:
- In this article we have seen about
- Range
- IQR
- Variance & Standard Deviation – We have for Sample and Population
- Except IQR all measures are sensitive to Outliers
- These are also called as Measures of Consistency.
- Except Variance all measures have the same unit of measure
- Shifting has no effect on Measures of Spread
- For standardizing data, we used Z-Score
We have you have enjoyed this article and learning about Measures of Spread especially about variance and Standard Deviations. We will back with interesting articles, till then enjoy our other articles

[…] Measures of spreads range variance standard deviation […]
[…] Measures of spreads range variance standard deviation […]
[…] https://ainxt.co.in/measures-of-spreads-range-variance-standard-deviation/ […]
Aw, this was an incredibly good post. Spending some time and actual effort to make a
great article… but what can I say… I put things off a lot and don’t seem to get nearly anything done.
0mniartist asmr
I think the admin of this site is truly working
hard in support of his web page, because here every material
is quality based data. asmr 0mniartist
What’s up colleagues, good article and pleasant urging commented here, I am in fact enjoying by these.
0mniartist asmr
[…] https://ainxt.co.in/measures-of-spreads-range-variance-standard-deviation/ […]