Hello Friends,
Welcome Back !!
Today we are starting new series of articles on Interview Guides that helps on preparing for Machine Learning algorithms. We articulated this article with interview prospect in mind. To begin with we start with first and foremost important topic when comes to machine learning is “Regression“. Under Regression, we are deep diving into “Linear Regression“.
Previously we have written on detailed python notebook that helps to understand Linear Regression through Python. Refer article here –> https://ainxt.co.in/comprehensive-guide-to-understand-linear-regression/
We strongly recommend to refer below articles first to have strong basics foundations on Statistics & Machine Learning Framework.
- https://ainxt.co.in/statistics-and-sampling-distribution-through-python/
- https://ainxt.co.in/fun-with-functions-to-understand-normal-distribution/
- https://ainxt.co.in/measures-of-spreads-range-variance-standard-deviation/
- https://ainxt.co.in/six-modules-of-any-machine-learning-applications/
Table of Contents
What is Linear Regression?
It is a linear approach to modelling the relationship between a response variable (usually continuous variable) with one or more explanatory variables. In case only one explanatory variable it is called as “Simple Linear Regression” and more than one explanatory variable is known as “Multiple Linear Regression”. A linear regression line has an equation of the form “Y = a + bX“, where X is the explanatory variable and Y is the dependent variable. The slope of the line is b, and a is the intercept (the value of y when x = 0).
Advantages:
- Linear Regression performs exceptionally well for linearly separable data, we can use Linear regression to find the nature of the relationship among the variables.
- Linear Regression is prone to over-fitting but it can be easily avoided using Dimensionality Reduction techniques, Cross-validation and Regularization (L1 and L2)
Disadvantages:
- Sometimes Lot of Feature Engineering is required
- Prone to multicollinearity: If the Independent features are correlated it may affect performance
- Prone to outliers: Linear regression is sensitive to outliers. So, outliers should be analyzed and removed before applying Linear regression to data set.
Assumptions
There are FIVE assumptions associated with a linear regression model:
- Linearity:
Relationship between Dependent(Y) and Independent(X) variable is linear. There is a change in Dependent(Y) due to one unit change in X1 is constant, i.e., the effect of X1 on Y is independent of other variables.
- Homoscedasticity:
The variance of residual is the same for any value of X.
- Independence:
Multiple linear regression should not be much Multicollinearity in Independent(X) variables, i.e., independent variables are not too highly correlated with each other.
- Normality:
All the variables in the data set should be Multivariate normal, i.e., any fixed value of X, Y is normally distributed.
- No Autocorrelation:
In Multiple Linear Regression, there should be no autocorrelation in the data, i.e., when the residuals are dependent on each other, there is autocorrelation.
Feature Scaling in Linear Regression:
Linear Regression use Gradient Descent as optimization technique & require data to be scaled.
Gradient Descent:

Gradient Descent Formula
Here,
The presence of feature value X in the formula will affect the step size of the gradient descent. The difference in range of features will cause different step size of each feature. “To ensure that the gradient descent moves smoothly towards the minima and that the step for gradient descent are updated at the same rate for all the features, we scale the data before feeding it to the model“.
Normalization:
Scaling technique in which values are shifted and rescaled so that they end up ranging between 0 and 1. It’s known as Min-Max scaling.

Normalization Formula
Performance Metrics – Linear Regression
1) Mean Squared Error (MSE)
MSE will average of the squared difference between the target value and the value predicted by the regression model.

Mean Square Error Formula
2) Root Mean Squared Error (RMSE)
RMSE will square root of the averaged squared difference between the target value and the value predicted by the model.

Root Mean Square Error Formula
3) Mean Absolute Error (MAE)
MAE is the absolute difference between the target value and the value predicted by the model.
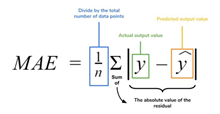
Mean Absolute Error
4) R2 Error
R2 helps to compare our current model with a constant baseline and provide the model accuracy. The constant baseline is chosen by taking the mean of the data and drawing a line at the mean. R2 is a scale-free score that implies it doesn’t matter whether the values are too large or too small, the R2 will always be less than or equal to 1.

R Square Formula
5) Adjusted R2 Error
Adjusted R2 depicts the same meaning as R2 but is an improvement of it. R2 suffers from the problem that the scores improve on increasing terms even through the model is not improving which may misguide the end-user. Adjusted R2 is always lower than R2 as it adjusts for the increasing predictors and only shows improvement if there is a real improvement.
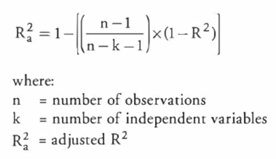
Adjusted R Square Value
Cost Function
Cost Function is a measure of how wrong the model is in terms of its ability to estimate the relationship between X and Y. This is typically expressed as a difference between the predicted value and the actual value.
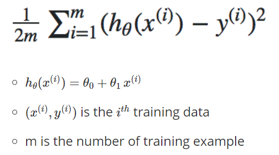
Cost Function Formula
Minimizing the Cost Function: Gradient Descent
Gradient Descent is an efficient optimization algorithm that attempts to find a local or global minimum of a function. Gradient Descent enables a model to learn the gradient or direction that the model should take to reduce errors. As the model iterates, it gradually converges towards a minimum where further tweaks to the parameters produce zero changes in the loss.

Minimize Gradient Descent
Thanks for staying there and reading this pocket guide on Regression. We hope this helps to refresh your knowledge on this topic. Let us know your feedback on this article and share us your comments for improvements. We will come with interview guide on next topic, till then enjoy reading our other articles.






Nice article Balaji.
Thanks 🙂
[…] https://ainxt.co.in/step-by-step-interview-guide-on-linear-regression-algorithm/ […]
Hey there! Quick question that’s completely off topic.
Do you know how to make your site mobile friendly?
My site looks weird when viewing from my iphone. I’m trying to
find a template or plugin that might be able to fix this problem.
If you have any recommendations, please share. Cheers!
Feel free to visit my blog post – daftar slot online