Hello Friends,
Welcome Back !!
Power of Statistics helps a data scientist to understand the data, make inference with greater confidence. Stats that are produced from sampled data are estimate of hidden iceberg of huge real world data. But these stats should be through properly chosen sampled data. Hence, it becomes very important to understand What is Sampling ? What is Sampling Procedure ? and What is Random Sampling ?
Today’s article helps to deep dive in to this topic with clear examples. Take a look on our some of previous articles to have some solid basics on this topics
- https://ainxt.co.in/statistics-and-sampling-distribution-through-python/
- https://ainxt.co.in/fun-with-functions-to-understand-normal-distribution/
- https://ainxt.co.in/deep-diving-into-normal-distribution-function-formula/
Table of Contents
Statistical Interference
To understand the meaning of Statistical Interference, let’s first understand what is meant by Population in Statistical World ? “Population” refers to total collection of objects or people that are our area of interest, to be studies or observed i.e. every member of the group !!
Example: You own a manufacturing plant that produces Electric Bulb. Population here represents all the total number of Electric Bulb’s produced right starting 1st day of your company.
What we really need is to understand the “Characteristics of the Population”, we are interested in ?
For our case of Electric Bulbs, some of the Characteristics are
- Luminance – brightness that my bulbs produces
- Life Time Expectancy – Guaranteed duration that i promise
- Power in Watts
Let’s say, before going for sales, as a owner of the manufacturing company & in order to gain customers trust, i want to ensure the Life Time Expectancy or minimum guarantee that the bulb will glow (Say Average : 30 Days) to the customers.
How do we measure this Average duration of Electric Bulbs ?
Take one Electric Bulb that was produced, supply with electricity & measure total no of days it was glowing before dying. To get the average, we have to measure total no of days Bulb was glowing for all the Electric Bulbs that was produced by the company.
Only problem is we have “Nothing left to Sell“, since we took all the populations that we are interested in for measuring the characteristics but with an advantage of “Exact Value of Total Durations these Electric Bulb will last for…”.
Is this affordable ? Or Is this even possible to do ? So What i do ? – We take a “Sample“. Sample is Subset of Population.
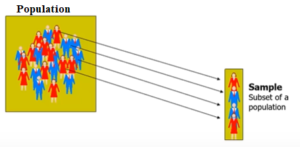
We take a small sample of Total Electric Bulbs produced (Say 100 no’s) and calculate the characteristics like Durations of glow etc.. and see if this is acceptable or not.
Note: Whatever the sample i have taken must be a representative of Population.
“The process of taking sample from total population is known as Sampling“. This Sampling process should be such that these samples represent the population accurately. Once i have sample, i analyze the sample data and draw conclusions about population. This process is known as “Statistical Interference“.
By Statistical Interference – we have “Certain Amount of Uncertainty“, because we only took a small subset from populations to draw conclusions.
Sample Statistics Vs Population Parameters
- Sample Statistic is a characteristic of the sample
- Sample Statistic is used as point estimate for Population Parameter

Note: Generally in statistical world, population parameters are denoted using Greek letters like μ, σ, etc… Similarly for Statistic represented using English Alphabets like X, S, etc…
Random Sampling
Consider a population data that contains 5 records each represent a Company Name that produces Beverages & its Customer Ratings. We will find the Mean & Standard Deviation of this population dataset as shown below:

Next, we can take samples of 3 companies from the population dataset. We have nCr = 5C3 = 10 different combinations of samples & its ratings in matrix, can be formed as shown below. With this we are left even a single samples left out from population dataset.
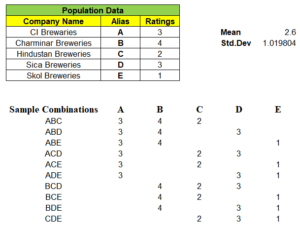
Example: One of 3 samples from given 5 records of population dataset be “ABD” and we have mapped its rating A=3, B=4 & D=3 in its respective columns. We find the mean of these 10 different combinations of samples.
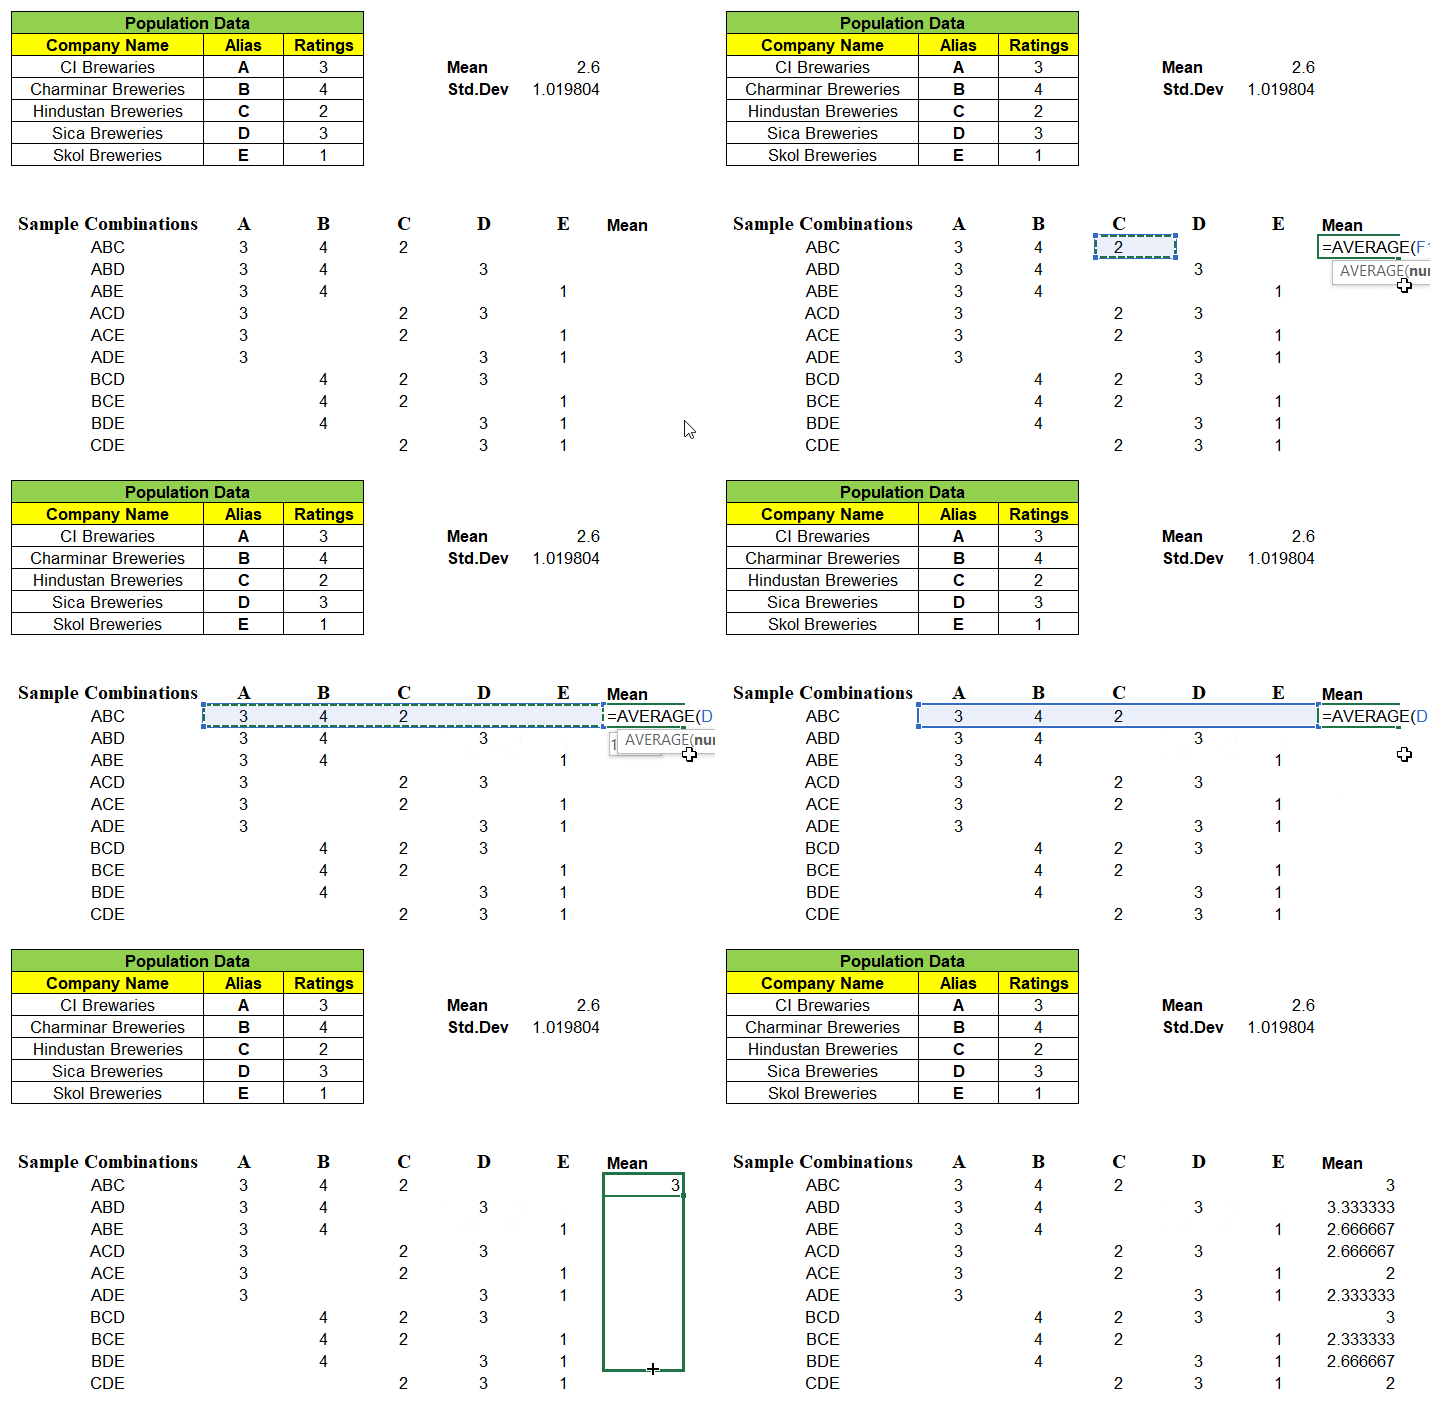
Note: “Not a single sample mean is exactly same as that of population mean i.e. 2.6″
So, Probability of Sample Mean(x̄) equal to Population Mean(μ) is 0. Very Important point to be noted. This confirms that sample data will always have some uncertainty.
As we have all of the sample means, we can calculate “Mean of the Sample Means”

Notice, “Mean of the Means i.e. mean of all the sample means is exactly equal to Population Mean” i.e. 2.6
For given samples, observe that the sample mean x̄ is a random variable and can take any of the values 3, 3.33, 2.66, 2 and probability associated with it. Ex: Probability of Sample Mean x̄ taking value of 2 = 2/10 = 0.2, similarly P(x̄) = 2.67 = 3/10 = 0.3 etc…
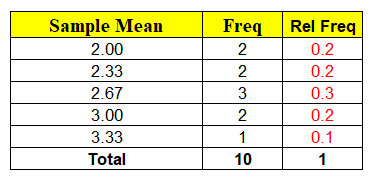
The minute we have random variable (x̄) we have probabilities associated with each of the values x can take as shown above. Hence, we can calculate the Expected Mean E ( x̄ ) = μ = ∑ x P ( x )
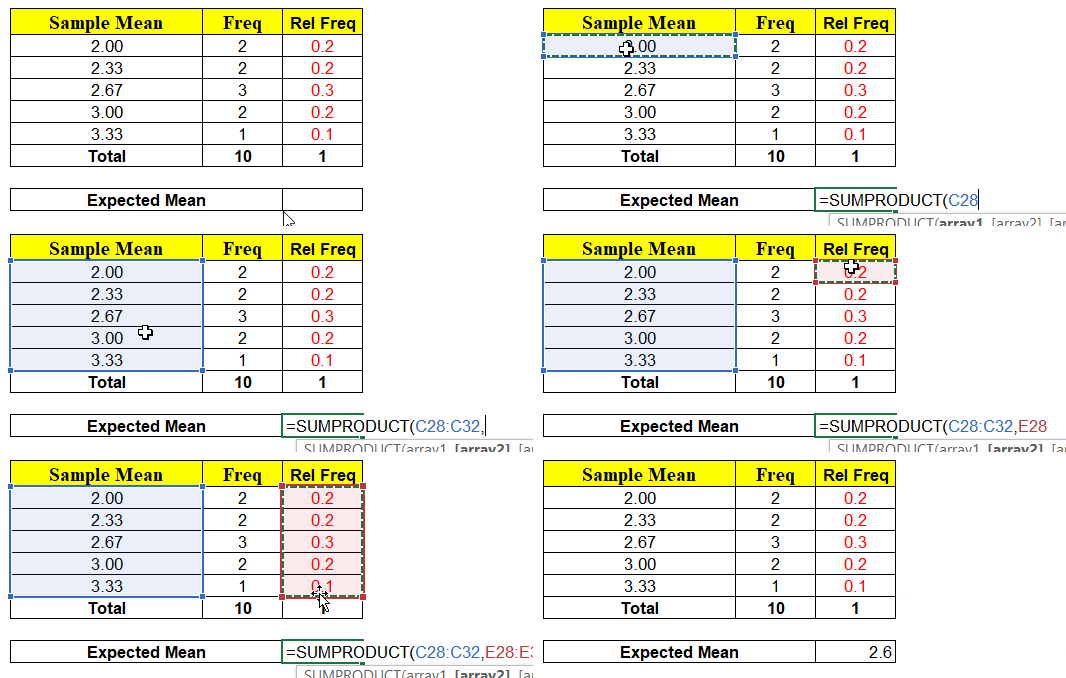
Again, the Expected Mean of Random Variable(x̄) = 2.6 which is exactly equal to Population Mean. Conclusion ? “Probability P(x̄ = μ) = 0 but expected value E ( x̄ ) = μ“. How always E(x̄) = μ ?
Going back to our list of all possible samples from population – ABC, ABD, ABE, ACD, ACE, ADE, BCD, BCE, BDE, CDE – Probability of company A included in the sample = 6/10=0.6 i.e. (ABC, ABD, ABE, ACD, ACE, ADE). Similarly take any other value i.e. B or C or D or E – probability of that company getting included in the sample to be 0.6.
In other words, the probability that any of these 5 Companies included in the sample is same. How do we use this in Real life ? In Real life, we will get only one sample representation for a population and we need to draw conclusions based on that.
We need that one sample representation such that E ( x̄ ) = μ. How can we guarantee this ? If we “make sure each item of population (company in our case) has exactly same probability of getting include in the sample” – Known as RANDOM SAMPLE then we can confirm E ( x̄ ) = μ.
How about Standard Deviation ? The Standard Deviation of Sample Means σx̅ (0.4163) is not equal to Population Standard Deviation σ (1.019) and the formula is given by,
Scary? We will simplify now !! Before that let us substitute the values in above formula and see the value matches with Population Standard Deviation.
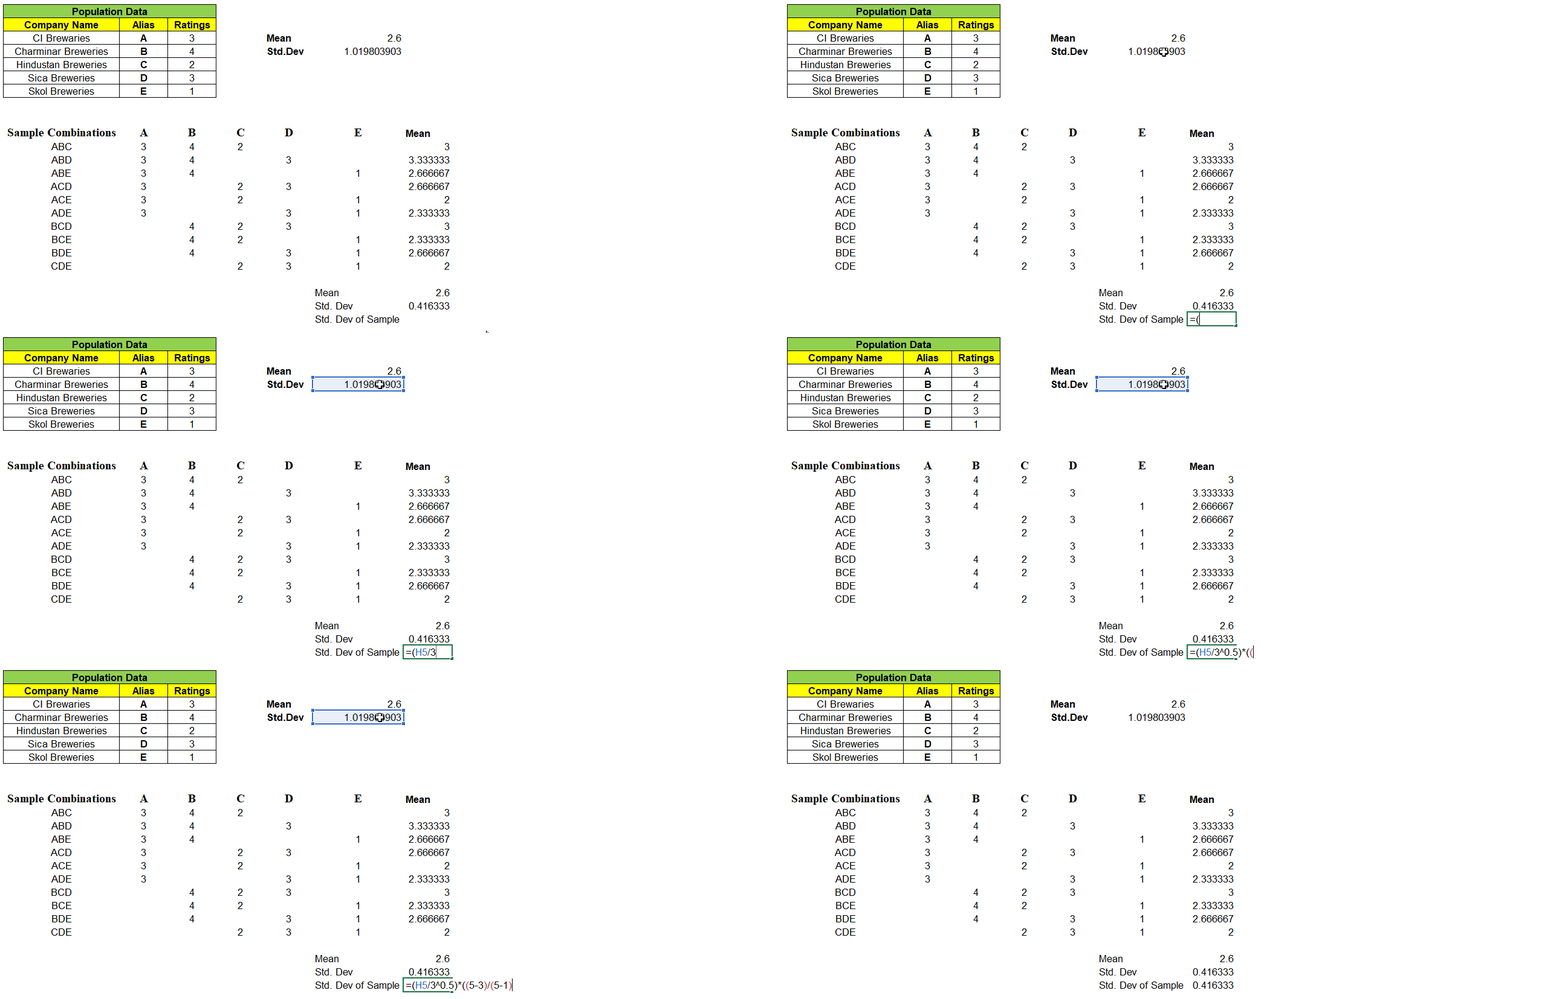
If we have large number of sample values, the right side of the formula value is very small and hence negligible. New Standard Deviation of Sample Means σx̅

Conclusion
Time to recollect the learnings so far we had
- Making inference from Population data is almost impossible, hence we go for Sampling
- Sampling through Random Sampling is best method, however many ways of sampling exists.
- Random Sampling – Each item of Population has same probability of getting included in the sample
- The Expected Value of Sampled data E ( x̄ ) will be always equal to mean of the Population data μ i.e. E ( x̄ ) = μ
- The Standard Deviation of Sampled data σx̅ will be equal to Standard Deviation of Population data divided by root of number of samples i.e. σx̅=σ/√n
We hope you enjoyed this article. Now it will make sense why Random Sampling is most widely used in analytic worlds for Statistical Interference. We will continue the article with extension of Central Limit Theorem soon !! Till then, Keep Reading !!
- https://ainxt.co.in/introduction-to-collection-principles-and-applications-in-analytics/
- https://ainxt.co.in/importance-of-taylor-series-in-deep-learning-machine-learning-models/
- https://ainxt.co.in/step-by-step-interview-guide-on-decision-tree-algorithm/
- https://ainxt.co.in/deep-learning-on-types-of-activation-functions/
Credits: This article is originally inspired from Prof. Nagadevera during his Statistics class at ISB.






[…] https://ainxt.co.in/how-to-do-sampling-through-random-sampling-process/ […]
[…] https://ainxt.co.in/how-to-do-sampling-through-random-sampling-process/ […]