Hello Friends,
Welcome Back !! Happy New Year 2022🙂
After a short break, we are back on sharing our knowledge. As always, we are committed towards writing quality articles that helps data science community. Today we wanted to talk about once again important and basic knowledge that every data scientist should have – “Probabilities“.
Today, we are going to talk about one of the book we came across written by Gerd Gigerenzer – “Reckoning with RISK: Learning to live with uncertainty“. This article 100% inspiration from this book and dedicate to author.
- https://ainxt.co.in/how-to-do-sampling-through-random-sampling-process/
- https://ainxt.co.in/making-statistical-inference-using-central-limit-theorem/
- https://ainxt.co.in/introduction-to-collection-principles-and-applications-in-analytics/
- https://ainxt.co.in/applied-statistics-using-binomial-distribution-for-employee-attrition/
- https://ainxt.co.in/step-by-step-interview-guide-on-logistic-regression-algorithm/
Table of Contents
Author Introduction
Gerd Gigerenzer – from Germany, is director emeritus of the Center for Adaptive Behavior and Cognition (ABC) at the Max Planck Institute for Human Development. His area of interest mainly focus on using bounded rationality and heuristics in decision making.
He is widely known for developing “Adaptive Toolbox” – provides ability to choose heuristic for problem solving. He was author of many books including
- “The Empire of Chance: How Probability Changed Science and Everyday Life (1989)“
- “Simple Heuristics That Make Us Smart (1999)” etc…
Book Introduction
We were lucky to come across this book which talks about risk & uncertainty in realistic approach. Author never hesitates claiming bold statement, that we live in a world of uncertainty. Even Technology prone to errors.
Gerd pinpoints how our minds percepts this uncertainty into illusion of certainty that leads to wrong decisions often in real life.
Author was from medical background, hence he provides us with example how physicians unaware of uncertainty, inability to reason appropriately i.e. Innumeracy. Author also talks about Risk & its Types like below and how to overcome these.
- “Illusion of Uncertainty” – person know about risk, but provides tool to overcome uncertainty
- “Miscommunication of Risk” – person knows the risk, but not aware of how to communicate with others
- “Ignorance of Risk” – person know aware of how much a relative risk is
- “Clouded Thinking” – person knows the risk, but do not know how to draw conclusion from it
Note: What we have shared here is only tip of iceberg given in the book. We strongly recommend to read this book, in case of more details from here –> https://www.amazon.in/gp/product/0140297863?ie=UTF8
Example – Problem Statement
In this book, author gave below probability question to physicians to break through.
“The probability that one of these women has breast cancer is 0.8 percent.
If a women has breast cancer, the probability is 90 percent that she will have a positive mammogram.
If a women does not have a breast cancer, the probability is 7 percent that she will still have a positive mammogram.
Imagine a women who has a positive mammogram. What is the probability that she actually has breast cancer?”
Author wanted to show us, how extremely harder for general physicians to decode this problem when given it terms of probability. Of course, this problem is not only harder for physicians or doctors, but also for many Engineers a.k.a. “Data Scientist” who have studies probability and Statistics.
Some of them can identify that the above problem can be approached using Bayes’ Theorem.
Introduction – Bayes’ Theorem
Bayes theorem is a theorem in probability and statistics, named after the Reverend Thomas Bayes, that helps in determining the probability of an event that is based on some event that has already occurred.
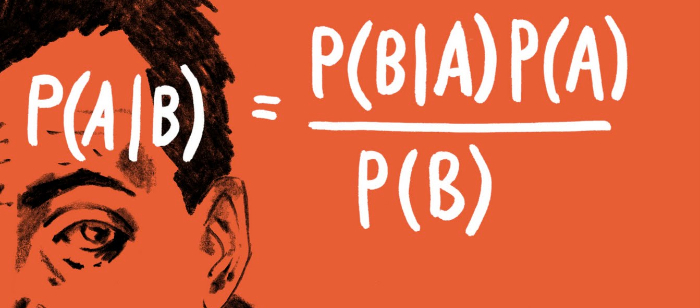
Bayes theorem states that the conditional probability of an event A, given the occurrence of another event B, is equal to the product of the likelihood of B, given A and the probability of A. It is given as:
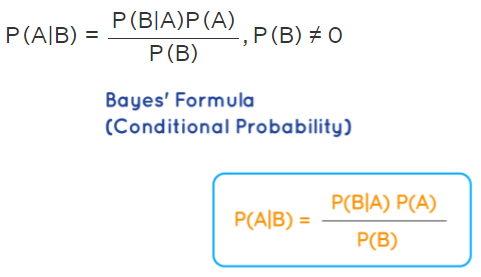
where,
- P(A) = how likely A happens(Prior knowledge)- The probability of a hypothesis is true before any evidence is present.
- P(B) = how likely B happens(Marginalization)- The probability of observing the evidence.
- P(A/B) = how likely A happens given that B has happened(Posterior)-The probability of a hypothesis is true given the evidence.
- P(B/A) = how likely B happens given that A has happened(Likelihood)- The probability of seeing the evidence if the hypothesis is true.
Solution – Using Bayes’ Theorem
Often, many of us fail when converting this generalized Bayes’ formula for a given problem. First, need to figure out what is prior knowledge, then Marginal and likelihood etc…. and even one wrong assumptions, output is miserable. It takes lot of practice to master on probabilities.
So, for given problem
- P(A) – Prior Knowledge = P(getting Disease i.e. Breast Cancer) = 0.8% = 0.8/100 = 0.008
- P(A’) = P(Not getting Disease) = 1 – P(A) = 1 – 0.008 = 0.992
- P(B|A) = P(Positive Mammogram | Disease) = 90% = 90/100 = 0.9
- P(B |A’) = P(Positive Mammogram | No Disease) = 7% = 7/100 = 0.07 – This is really confusing i.e. False Positive, little harder to digest.
- P(B) = P(Positive Mammogram) – Total Conditional Probability i.e. Total Evidence of Positive Mammogram
= P(A)*P(B|A) + P(A’)*P(B|A’)
= P(Disease)*P(Positive Mammogram | Disease) ) + P(Not getting Disease)*P(Positive Mammogram | No Disease)
= 0.008*0.90 + 0.992*0.07
Therefore, substituting in all these values we can find P(Breast Cancel | Positive Mammogram) i.e. P(A|B)
- P(A|B) = P(Disease | Positive Mammogram) = P(Disease) * P(Positive Mammogram | Disease)
———————————————————————————————————————————-
P(Disease)*P(Positive Mammogram | Disease) + P(No Disease)*P(Positive Mammogram | No Disease)
= 0.008 * 0.90 / (0.008 * 0.90 + .992 * 0.07)
= 0.0072 / 0.07664 = 0.0939 = 9.39% ≈ 9%
We took lot of pain to decode given probabilities and found its conditional probabilities and finally substituting these values in Bayes’ Formula to arrive at the ask i.e. Probability of women having breast cancer given positive mammogram result, which is 9%.
Simplistic Approach – Using Natural Frequencies
Instead, author has converted the same probability question in terms of Natural frequencies as below,
“Eight out of every 1000 women have breast cancer.
Of these 8 women with breast cancer, 7 will have a positive mammogram.
Of the remaining 992 women who don’t have breast cancer, some 70 will still have a positive mammogram.
Imagine a sample of women who have positive mammogram in screening.
How many of these women actually have breast cancer?”
Problem seems more realistic now. Our mind can perceive it very clearly using Natural Frequencies. Answers seems no more nightmare to solve. All we need to do is draw below tree figure to easily draw conclusions.
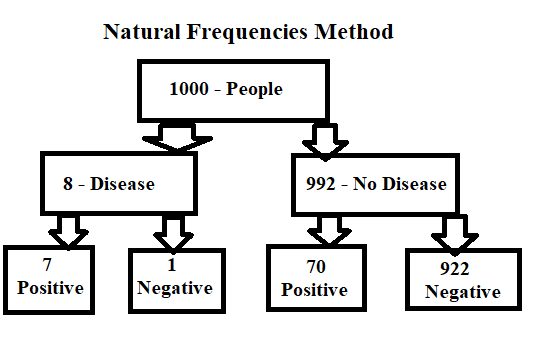
Now, once we have this graph, it is very simple to find out the ask i.e. Probability of women having breast cancer given positive mammogram result,
P(Disease | Positive Mammogram) = 7 / ( 7 + 70) = 7 / 77 = 0.09 = 9.09% ≈ 9%
Conclusion
Natural frequencies are more attached to humans than dealing with probabilities. Good numeric representation is a key to effective thinking that is not limited to understanding risks.
Hence, whenever we deal with complex interview questions in probabilities, it is wise to take the approach of Natural frequencies instead of remembering formulas. This way we can intuitively approach harder problems much easily and tackle them.
We would personally thank author – Gerd Gigerenzer for this great book. It helped to avoid cloud thinking. We highly recommend buddy aspirants who want to enter into analytics to take on this book that teach us how to think in terms of natural frequencies.
- https://ainxt.co.in/fun-with-functions-to-understand-normal-distribution/
- https://ainxt.co.in/deep-diving-into-normal-distribution-function-formula/
- https://ainxt.co.in/importance-of-taylor-series-in-deep-learning-machine-learning-models/
- https://ainxt.co.in/hidden-facts-of-cross-entropy-loss-in-machine-learning-world/


[…] https://ainxt.co.in/rethinking-probability-problem-using-natural-frequencies/ […]