Hello Friends,
Welcome back once again to our new interesting
article we talk about Vectors and Matrices and its impact on Data Analytics field. Previously we have discussed lot about Statistics, Probability, Normal distributions etc… and its importance especially focused towards mathematical function behind these concepts. We strongly recommend to refer these articles, if you haven’t seen yet. We are sure you will like it and leave us your comments for any improvements.
- Measures of Spreads – Range, Variance & Standard Deviation
- Measures of Spreads – Percentiles – Facts and Insights
- Measures of Centrality – Facts and Insights
- Fun with Functions to understand Normal Distribution
Alright, lets dive in our today topic of interest – Vectors and Matrices. Before getting into the use of Vectors and Matrices in Data Analytics / Data Science, first we will try to understand what is meant by Vectors, Matrix and operations performed on those.

Vectors
I am sure, we have studies about vectors during our school days. Let us take a look at below image, which is two dimensional / two co-ordinates (x1, x2) space. In this space, we have a point P located at (2,2). In Geometric representation, Vector is “The range that connects the origin of the space t0 point P“. A vector is quantified by its Magnitude & Direction. Magnitude is given by sum of the squares of co-ordinates and then take square root of it. Direction is based on the values of Co-ordinates, can be left/right of origin and similarly up/down of origin.
Python code:
 plt.quiver(0,0,3,4, scale_units='xy', angles='xy', scale=1, color='r')

plt.quiver(0,0,-3,4, scale_units='xy', angles='xy', scale=1, color='g')

plt.xlim(-10,10)

plt.ylim(-10,10)

plt.show()
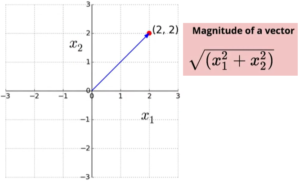
understanding vector with example
How to add/subtract two vectors?
It’s very easy, add/subtract each vectors at element wise.
Python Code:
vecs = [np.asarray([0,0,3,4]), np.asarray([0,0,-3,4]), np.asarray([0,0,-3,-2]), np.asarray([0,0,4,-1])]
vecs[0] + vecs[3]
plot_vectors([vecs[0], vecs[3], vecs[0] + vecs[3]])
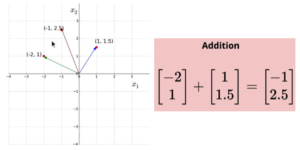
Operations on vector
How to multiply two vectors (Dot Product) ?
Multiplying two vectors result in scalar value. Its is summation of element wise multiplication of two vectors as shown below.
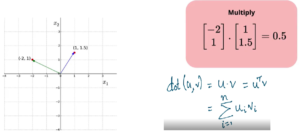
multiplying two vectors
Note: Any vector with magnitude of value 1 is know as “Unit Vector“.
Suppose we have a vector and needs to convert into unit vector, then we can divide the vector by its magnitude. Now can we project one vector over another vector ? Let’s say we have two vector x̅ & ȳ and the question we are trying to ask is what is the projection of x̅ on ȳ. Two things we observe from the below image is now the direction of x̅ will be same as of ȳ. And the project of x̅ will be either scaled up or scaled down version of ȳ. The projection of vector is given by the formula as shown in below image. To interpret the formula is actually it is dot product of two vectors x̅ & ȳ and denominator is magnitude of ȳ over ȳ.
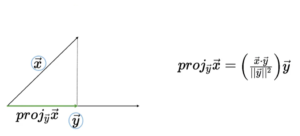
Projection of Vectors
Compute angle between two vectors
The Cosine angle between 2 vectors is given by “dot product of two vectors x̅ & ȳ divided by magnitude of two vectors x̅ & ȳ“. Look at below image of finding angle between 2 vectors.
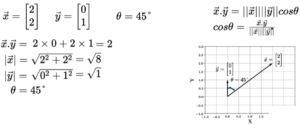
Angle between two vectors
Note:
- In this article, we refer only 2 dimensional vectors. However the formula and method of calculations remains same for any n dimensions.
- Given 2 vectors are said to orthogonal i.e. angle between vector is 90° , if the dot product of two vector is “0”
Why do we care about Vectors?
Till now, we have seen what are vectors is all about, operations on vector, unit vector, projecting one vector on another and calculate angle between the vectors.
Example1: Suppose we want to predict whether the cellphone that gonna be newly launched will hit in the marked based on parameters collected. These parameters can be price, screen size, memory etc… We will store these parameters in a vector as shown below.
![]()
Example2: Another example is image, where image has pixel value of 28 x 28, each pixel refers the RGB/grey scale value and we need to identify the given image contains value 4 or not.
![]()
Therefore the key thing to takeaway is “All entities in Machine Learning can be represented as Vectors with its own dimension” Also we can compute angle between 2 vectors which gives an idea whether the vectors are similar or far from each other. With this, we wind up about vectors and move to our other topic of this article – Matrix.
- Deep Diving into Normal Distribution Function Formula
- Statistics and Sampling Distribution through Python
- How Confident are you with Confident Intervals ?
Matrices
Think of Matrices as – “Collection of Vectors”, which results in Rows x Columns. If we look at column wise – we call it as Column Vector and similarly at row wise it is Row Vector.
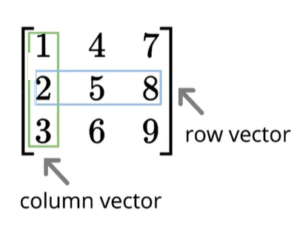
Matrix
How to add/subtract two Matrices?
Similar to vector addition or subtraction operations, in matrix too we do element wise addition or subtraction at both row level and column level. Point to be noted is only if the both the matrix are of same size we can do operations. Refer below image for example.

Operations on matrix
How to multiply a matrix with vector?
Suppose we have ℝ2×2 matrix and need to multiply with ℝ2×1 then matrix to vector multiplication can be obtained by “Dot product of every row of the matrix with the column of vector” and the resulting output matrix will be of size of the vector ℝ2×1. What happens when matrix hits a vector ? The vector gets transformed into a new vector. Refer below image for reference.
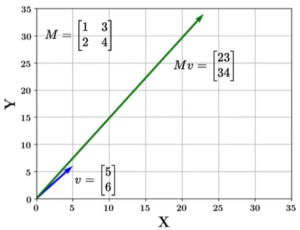
Multiply matrix with vector
Note: In order to multiply matrix with vector, it is necessary that No of columns in matrix should be same as No of Rows in vector.
How to multiply two Matrix?
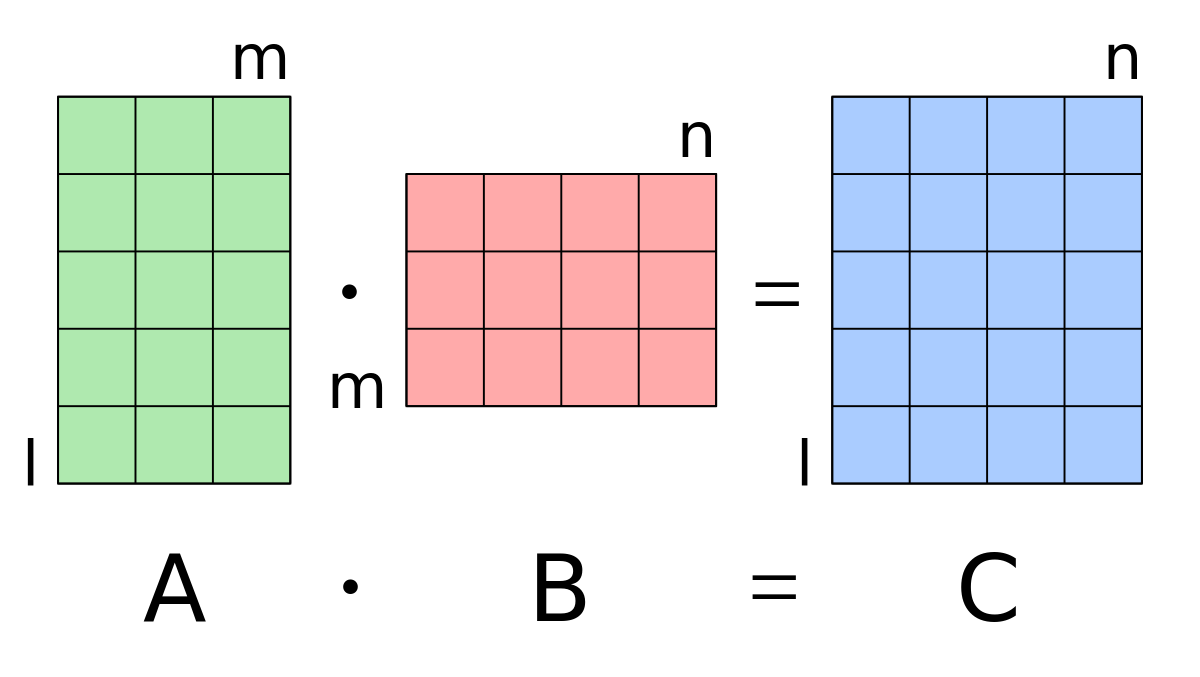
To multiply two matrices, operations we need to do is “Dot product of every column of matrix1 with every row of matrix2“. Similar to matrix to vector, for effective matrix multiplication no of columns in matrix1 should be same as of no of rows in matrix2. Therefor any M x N matrix can be multiplied with any N x K matrix to get a M x K output.

Matrix Multiplication example
Why do we care about Matrices?
Earlier in vectors, we understood that, we store parameters of any entity, say for our example of predicting hit of new phone launch, we stored the values in vectors. But vectors can store only for one phone. But in real case, we deal with parameters collected for many phones. Hence, we need matrix representation which is collection of parameters stored in vectors.
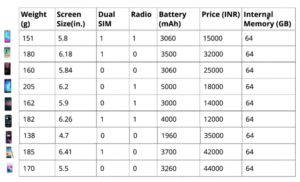
why do we care matrix
All our dataset that are fed as input for machine learning algorithms, we internally store as matrix. Thus Matrix and Vectors are very basis data structures that contains the real world data for analysis.
With this, we are coming to end of this article. we are sure by now you understood the importance of data structures Vectors & Matrices which are widely used in analytical world. Understanding these data structures helps to effective handling of data while processing. Do leave your comments or suggestions for improvements in this article and share with your friends if you like it. Next time, we will come with one more interesting topic. Till then, keep reading our previous articles shown below.






[…] Modules of any Machine Learning Applications Previous Six Modules of any Machine Learning […]
[…] importance of Vectors and Matrices in data science space. Refer this article here –> Vectors and Matrices – What are they & Why do we care for Analytics. Especially in the world of Computer Vision and Deep Learning, Vectors and Matrix play a very major […]
[…] https://ainxt.co.in/vectors-and-matrices-why-do-we-care-for-them-in-analytics/ […]